Absolutely! Let’s break down these two financial metrics with mathematical clarity.
1. Trailing 12-Month Distribution (%)
This metric calculates the percentage return an investor would have received from distributions over the past year, relative to their initial investment (adjusted for capital gains distributions). Here’s the formula:
Let:
* D_i = Distribution (income, capital gains, return of capital) for month i, where i ranges from 1 to 12.
* NAV_{recent} = Most recent Net Asset Value.
* CGD_i = Capital gain distribution for month i, where i ranges from 1 to 12.
Then:
Trailing 12-Month Distribution (%) = \frac{\sum_{i=1}^{12} D_i}{NAV_{recent} + \sum_{i=1}^{12} CGD_i} \times 100\%
Explanation:
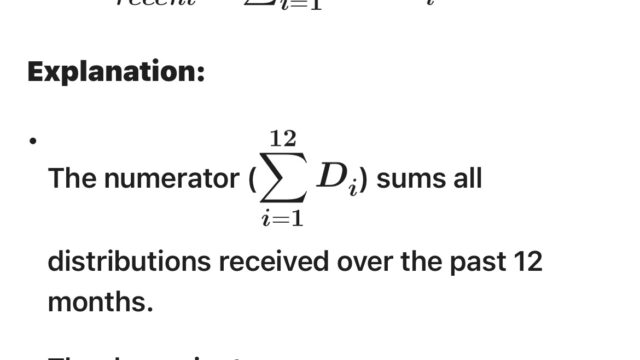
* The numerator (\sum_{i=1}^{12} D_i) sums all distributions received over the past 12 months.
* The denominator (NAV_{recent} + \sum_{i=1}^{12} CGD_i) represents the adjusted initial investment value. We add the sum of all capital gain distributions over the last 12 months to the most recent NAV. This adjustment is performed because capital gain distributions effect the NAV.
* We multiply by 100\% to express the result as a percentage.
* The “19a Notice” provides details on the distribution breakdown, including any return of capital.
2. Annualized Distribution Rate
This metric calculates the annualized rate of return based on the most recent distribution, assuming it remains constant throughout the year. Here’s the formula:
Let:
* D_{recent} = Most recent distribution amount.
* NAV_{recent} = Most recent Net Asset Value.
Then:
Annualized Distribution Rate = \frac{D_{recent} \times 12}{NAV_{recent}} \times 100\%
Explanation:
* We multiply the most recent distribution (D_{recent}) by 12 to annualize it.
* We divide the annualized distribution by the most recent NAV (NAV_{recent}) to find the rate of return relative to the current investment value.
* We multiply by 100\% to express the result as a percentage.
* Again, the “19a Notice” gives the distribution breakdown, including return of capital.
Key Differences and Important Notes:
* The Trailing 12-Month Distribution (%) reflects the actual historical distributions over the past year.
* The Annualized Distribution Rate projects a future return based solely on the most recent distribution, assuming it stays constant.
* Both metrics may include return of capital, which is important to understand for tax and investment implications.
* Neither of these metrics are indicators of total return. Total return would include the change in NAV in addition to distributions.
* Past distributions are not indicative of future distributions.


